- Natural as well as anthropogenic factors cause warming.
“Temperature increase is recovery from little ice age”, (page 1)
The graph below shows that this claim is not justified by considering available temperature data.
Note: Data prior to around 1880 is based on reconstructions from proxy sources e.g. ice cores and the like.
Source: NASA, at https://data.giss.nasa.gov/gistemp/tabledata_v4/GLB.Ts+dSST.txt, and https://www.carbonbrief.org
Graph constructed by Dr Andrew Meyenn, 5/09/2023
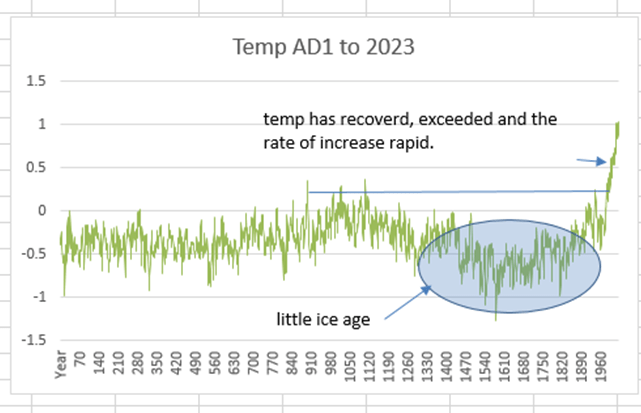
The data ranges from 1AD to 2023. The Little Ice Age is marked in blue.
The blue line shows the level of recovery of temperature back to slightly higher than average prior to the Little Ice Age.
Of note is the clear increase past this point and that the rate of increase (change) has accelerated.
The level of temperature increase is considerable and larger than at any time in the past 10,000 years or more.
Human Impact: Co2 and other GHGs and water vapor slows the escape of heat from the longwave Infrared radiation created by the Sun on the Earth’s surface. All things radiate IR radiation energy e.g. a stove, you etc. This energy needs to dissipate away from the source otherwise the object would continue to heat up. The Sun provides a constant source of energy (short wave) and hence the resultant heat needs to move away or the Earth would continue to heat up.
GHGs + water vapor interact with long-range energy wavelengths, and cause GHGS to vibrate (increase energy state) to return to the neutral non-vibrating state energy equivalent to that absorbed is released. This process continues up, and down in all directions some back to earth, and eventually some escape. The effect is to warm the lower atmosphere and earth’s surface as the IR comes back down – IR is heat.
If GHGs increase so too will the warming. The atmosphere at around 260-280ppm provided a slowing mechanism for the earth over the past many thousands of years resulting in an average temperature of around 13.5C (+/- 0.5). The current increases have resulted in an observed increase of approximately 1C.
Co2 doubling is expected to result in a rise in excess of 2.5C and more. You will note that the relationship between the amount of C02 and the increase in temperature is not linear, there is not a constant increase, fortunately. The relationship appears to be one where increases in CO2 result in smaller and smaller increases in temperature – a log relationship, but sensitivity analysis tends to suggest that the relationship is not that simple and hence the doubling may well result in 3C+ increase.
Natural causes of change are as follows: cooling via volcanic activity, cooling and warming by changes Earths rotations over 10,000-100,000 years, solar fluctuation on 10 year cycle and are not cumulative. None of these account for the sudden temperature rise as shown in the graph.
Conclusion: The evidence suggests that the recovery from the little ice age has been exceeded and continues. The time frame for the increase is very short in comparisons to fluctuations seen in the graph for the preceding time period.
I now consider the second and third related claims.
- Warming is far slower than predicted and Climate policy relies on inadequate models.
This point fundamentally relates to climate models and is completely inaccurate as I will now show.
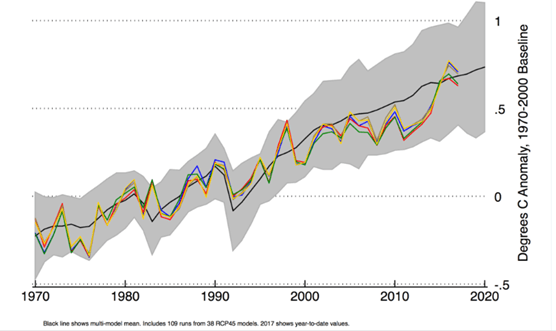
Source: https://www.carbonbrief.org/analysis-how-well-have-climate-models-projected-global-warming/
The models, based in differential equations, appeared around 1975 or so and predicted a 0.6C rise between 1960’s and 2000 – pretty accurate.
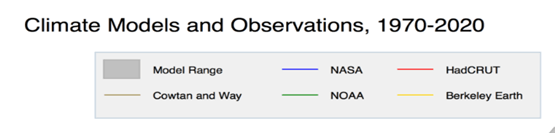
The graph above shows a black line which is the average of a collection of models, the other lines are observed temperature measurements from different land based and satellite sources.
As you can observe there is a good match. The grey areas represent confidence intervals. It is this that is used to claim the models are inaccurate, which they are clearly not as shown by the average that matches reality.
Conclusion: given the complexity of the problem the models are able to provide effective long term predictive capacity
Longer term perspective
Two data sets exist that show temperature anomaly variation and similarly for co2 over a considerable time scale.
The first shows temperature variation over 130,000 years and the second C02 over the same time frame. The scales on the x-axis are able to be matched. The Little Ice Age is marked by a small circle on both.
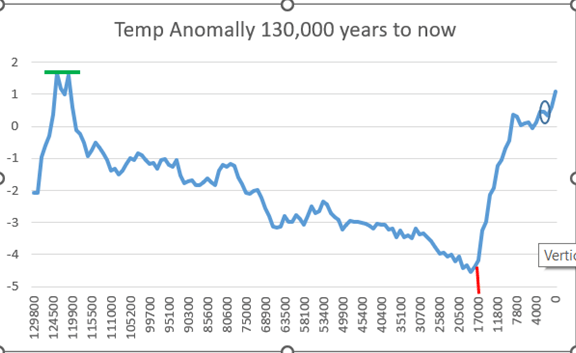
On the X-approx. 18,000-10,000 years ago is local Minimum on both graphs (see red vertical line), roughly the start of the end of the last major Ice Age. The Little Ice Age is circled on the right hand side and the rise is up to current temperature. The CO2 graph below shows that around 120,000 years ago CO2 was at a local maximum of approximately 280ppv and approx. 1.5C on the temperature graph, from that point co2 declined to around 180ppm which coincided with the end of the last major ICE age, 18000 years ago, co2 and temperature both began to increase. The circle shows the Little Ice Age period.
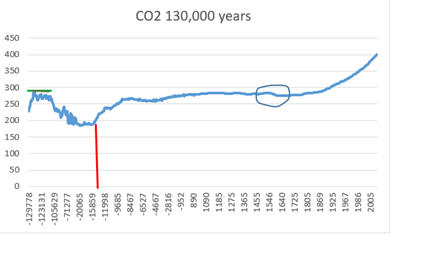
The sections marked with the green line show the start of a gradual decline in both temperature and CO2 levels (ppm).
The sections marked with the red line shows the start of recovery in temperature and CO2.
The temperatures seem to have recovered to around 1.1-1.5C
As temperature drops less vegetation and hence less CO2, but still CO2 from non-vegetation sources.
As both rise there is more vegetation and hence more CO2, and also from non-vegetation sources.
The current time frame of 100 years shows the large rise in CO2 and equally large steep rise in temperature. The first graph puts this in perspective and is what shows the current situation is different – the temperature rise is within a very small-time frame.
Finally, what caused the temperature and co2 decline and subsequent rise again. Unlike todays rise the time frame is over thousands of years.
