Comparison of Biden and Trump tweets

The report on this research can be found at:

https://drive.google.com/file/d/13Cgne35F4OckDIP8iOfsBaLYuecFxPsY/view?usp=sharing

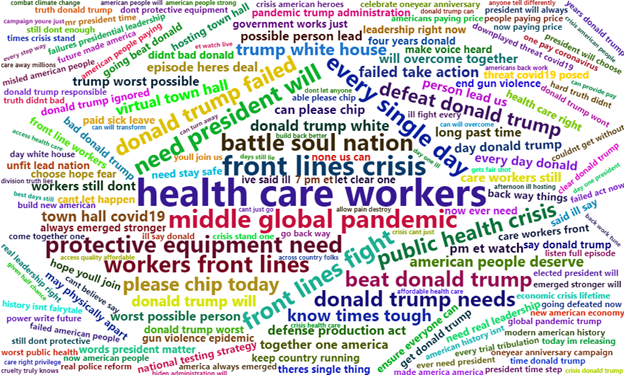
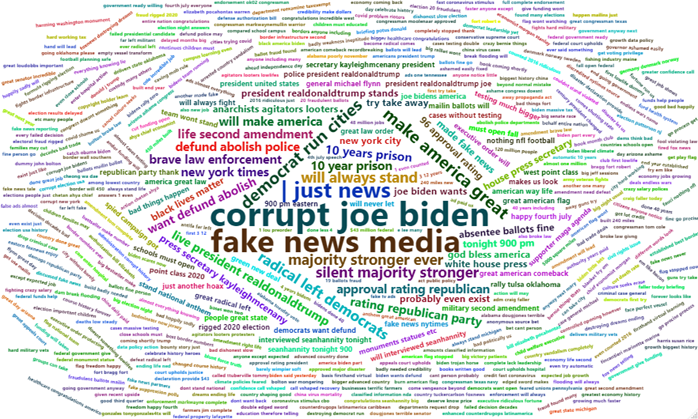
The two most interesting visualization are the wordclouds of three words phrases. Biden’s is first and then Trump’s.

Sentiment analysis showed only minor differences. However, the wordcloud’s show very different focus for both. Biden’s is characterised by more positive statements about issues and the need to defeat Trump. Trump’s on the other hand shows a strong focus on his slogans e.g. Corrupt Joe Biden.

Covid-19 US Race Investigation

The covid-19 death rate in the US is shown to have a statistically significant difference between between Afro-American (AA) and White (W) populations. The graph below shows the AA proportion difference compared to the W proportion below the x=0 line. There is a clear difference across nearly all states.

The full outline, R program and data file are available at ameyenn/covid19

The PCA biplot confirms the difference. The vectors show a negative relationship between AA and W, AA is linked with the poverty vector as well. NY is the main outlier.

A basic cluster plot across all the data is shown below.

A t-test was performed with the following results, indicating a statistically significant difference.

Welch Two Sample t-test

data: dt[, 1] and dt[, 2]
t = 3.7143, df = 80.722, p-value = 0.0003739
alternative hypothesis: true difference in means is not equal to 0
95 percent confidence interval:
0.3026568 1.0010984
sample estimates:
mean of x mean of y
2.688740 2.036862