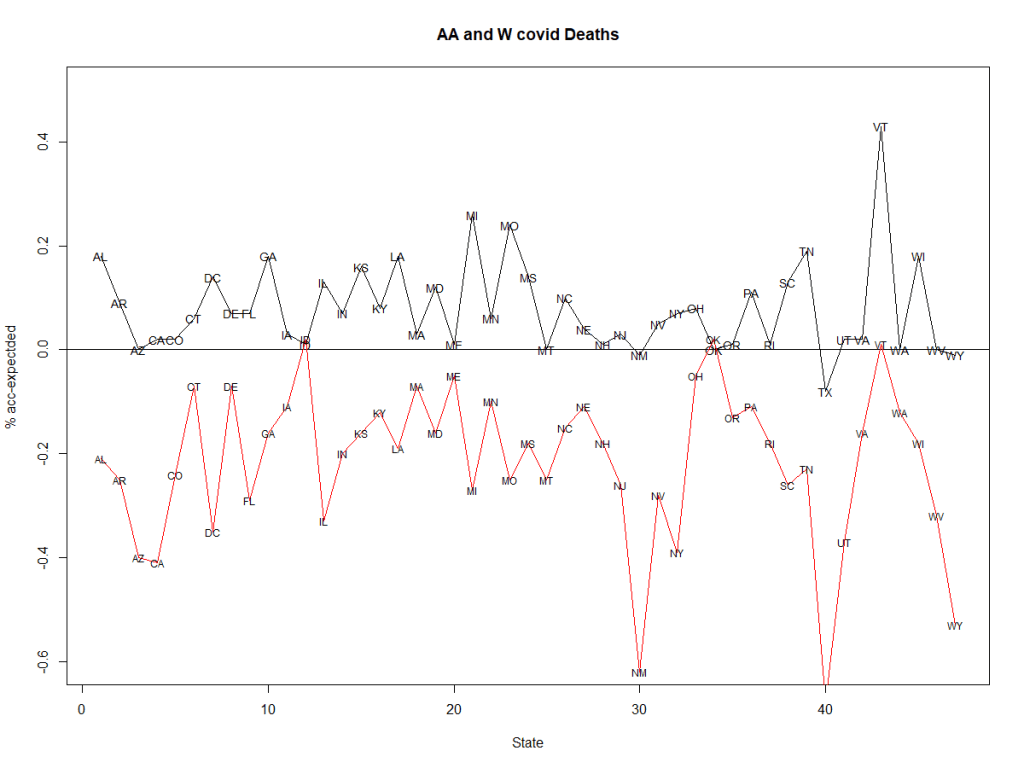
The covid-19 death rate in the US is shown to have a statistically significant difference between between Afro-American (AA) and White ![]() populations. The graph below shows the AA proportion difference compared to the W proportion below the x=0 line. There is a clear difference across nearly all states.
populations. The graph below shows the AA proportion difference compared to the W proportion below the x=0 line. There is a clear difference across nearly all states.
The full outline, R program and data file are available at ameyenn/covid19
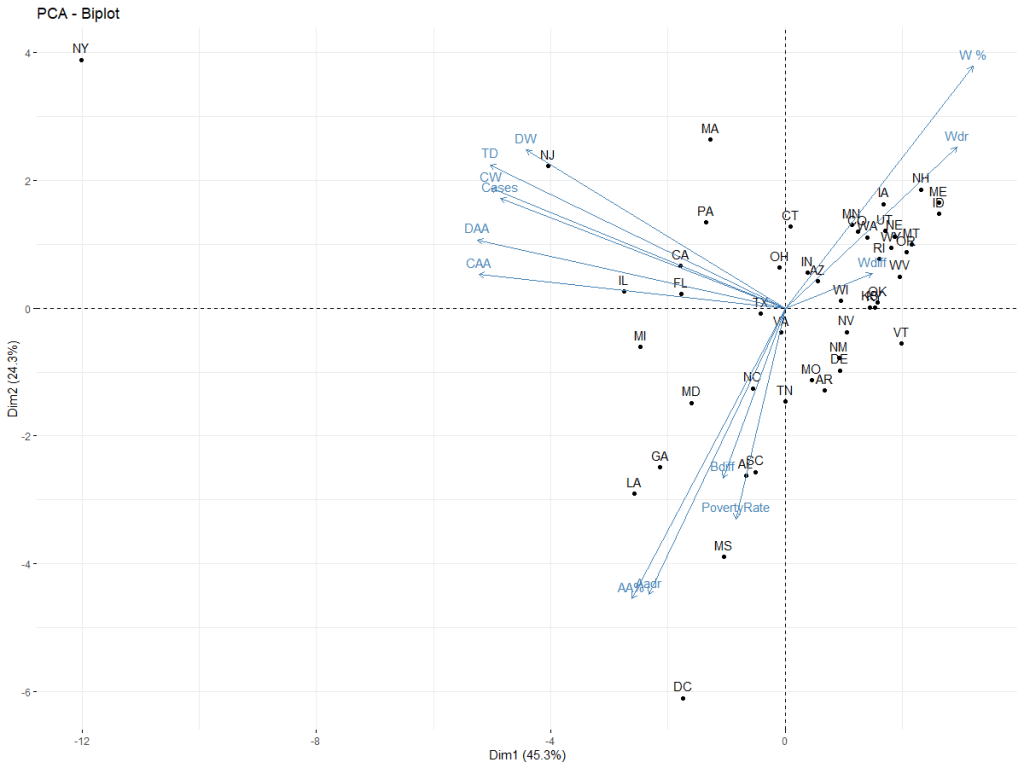
The PCA biplot confirms the difference. The vectors show a negative relationship between AA and W, AA is linked with the poverty vector as well. NY is the main outlier.
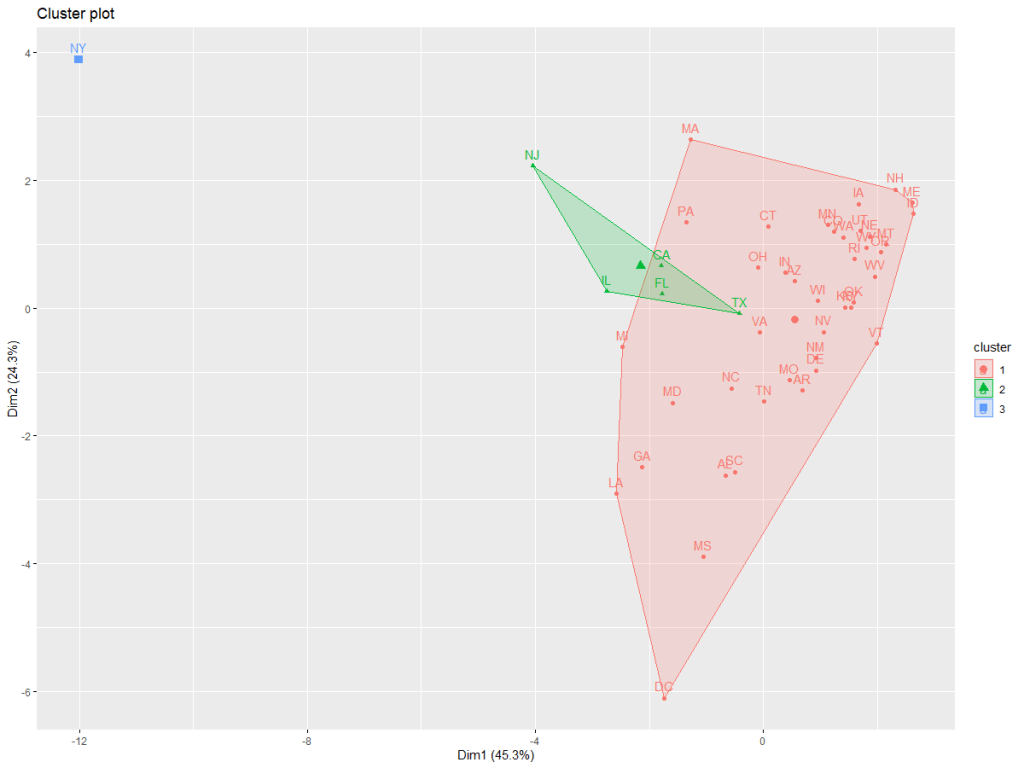
A basic cluster plot across all the data is shown below.
Welch Two Sample t-test
data: dt[, 1] and dt[, 2]
t = 3.7143, df = 80.722, p-value = 0.0003739
alternative hypothesis: true difference in means is not equal to 0
95 percent confidence interval:
0.3026568 1.0010984
sample estimates:
mean of x mean of y
2.688740 2.036862
